Visualizes the operating status of each power plant.
Key indicators: current production, availability, downtime and scheduled maintenance. Also tracks fuel consumption and CO₂ emissions. Graphs production over time and compares performance between different power plants.
A comprehensive set of functions
Supervision of power plants
Your operation and maintenance data in a customized dashboard
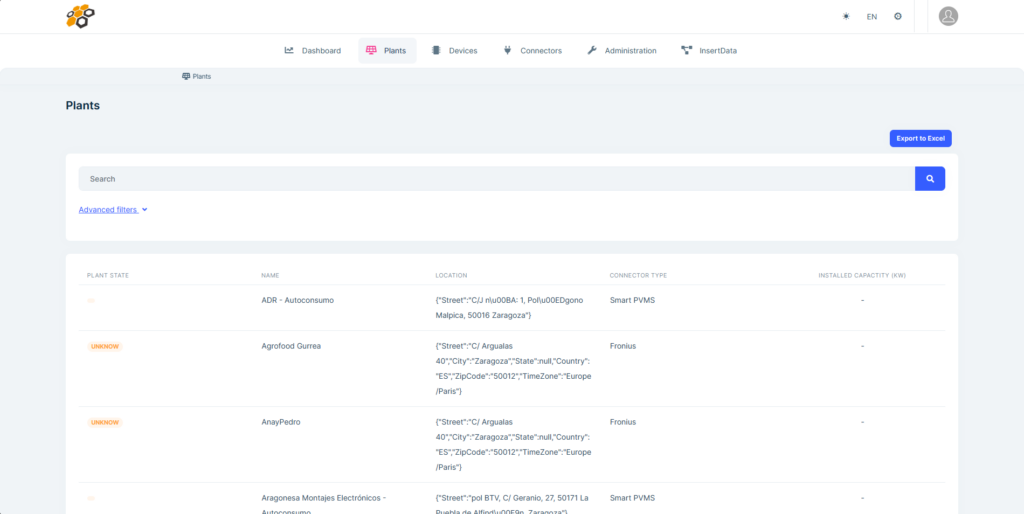
To efficiently monitor and manage multiple solar photovoltaic (PV) plants and their storage facilities, I propose a robust system based on dynamic charts and interactive graphs. Here is the adapted description:
Create pivot tables that display key data from your solar plants, such as daily production, efficiency, faults, etc.
Use advanced filters to select and visualize specific data. For example, filter by geographic location, plant type or capacity.
Allows users to edit and delete records directly from the table.
Graphically represent the KPIs of your solar plants. For example, graphs of monthly production, inverter efficiency, etc.
Create comparative graphs to identify sub-rendering plants.
Compare production between different locations or technologies.
Set visual alerts on graphs to highlight anomalies or underperformance.